
Risk · 3 of 3
The Sharpe ratio: what it is and how to read it
Two portfolios can end the year with the same return and still not be equally good: one may have put you through scares the other spared you. The Sharpe ratio puts a number on that difference and answers a very concrete question: am I being paid enough for the ups and downs I am enduring?
5 min read
In short
- The Sharpe ratio measures how much return you earn above the risk-free rate for each unit of volatility you put up with.
- It is calculated as (portfolio return minus the risk-free rate) divided by the portfolio's volatility.
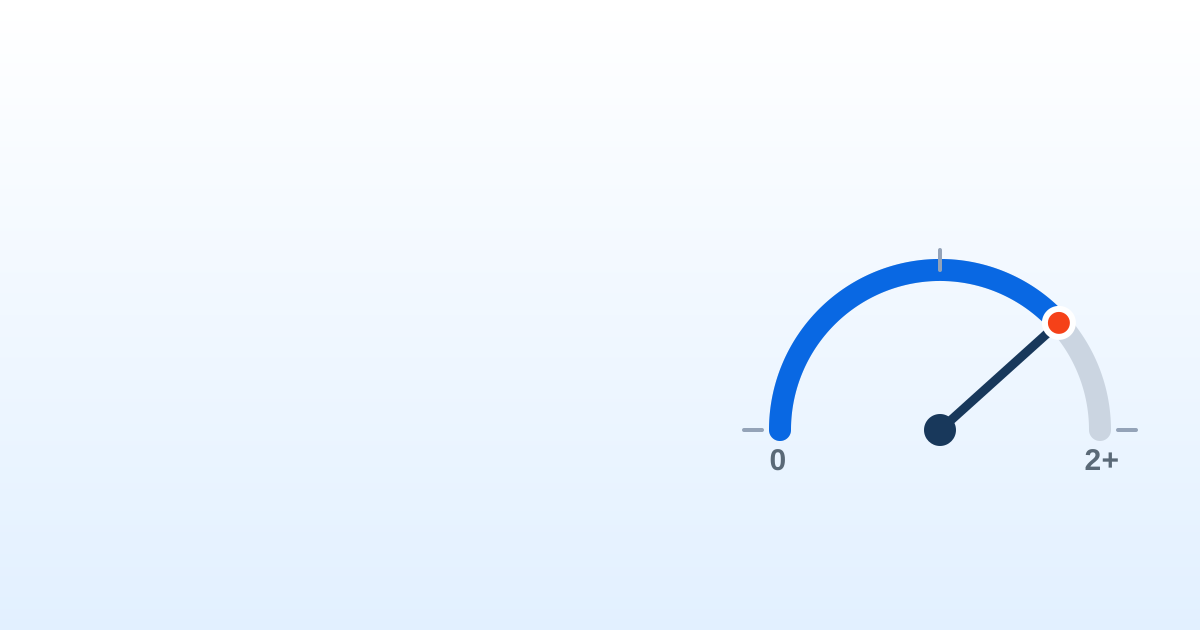
- As a rough guide, a Sharpe ratio below 1 is modest, between 1 and 2 is good, and above 2 is excellent.
- A negative Sharpe ratio means the portfolio returned less than a risk-free asset such as a Treasury bill.
What the Sharpe ratio is
The Sharpe ratio measures the return you earn for each unit of risk you take on. Instead of looking only at how much you gained, it factors in how much uncertainty you had to withstand to get there.
The idea is simple: earning 10% with a calm portfolio is not the same as earning that 10% with a portfolio that swings sharply up and down. The Sharpe ratio rewards the first one, because it delivered the same result with fewer jolts. That is why it is known as a measure of risk-adjusted return.
The intuition behind the formula
The formula compares three things: your portfolio's return, what you would have earned risking nothing (the risk-free rate, like a Treasury bill), and how much your portfolio swings (its volatility or standard deviation).
In short: (portfolio return − risk-free rate) divided by volatility. The numerator is your reward for investing instead of keeping the money safe; the denominator is what that reward cost you in nerves. The bigger the reward and the smaller the swings, the higher the ratio.
How to read it
Check first whether it is positive
A positive ratio means your portfolio beat the risk-free rate. If it is negative, you would have been better off with a risk-free asset: you are not being paid for the risk you take on.
The higher, the better
For the same return, a higher ratio means you achieved it with fewer swings. It is most useful for comparing portfolios or funds against each other, not as an absolute grade.
Use a rough reading
As a rough guide: below 1 is modest, between 1 and 2 is good, and above 2 is excellent. These are only indicative bands, not exact boundaries.
Its limits and the takeaway
The Sharpe ratio is not an absolute truth. It depends on the period you measure and shifts with the slice of history you pick. It also penalizes upswings and downswings alike, when in reality upside volatility does not bother you. And it assumes returns behave more or less “normally,” which markets do not always do.
It is also easy to dress up: by lengthening the period or cherry-picking dates it can be made to look better than it is. Treat it as a compass, not a verdict.
MyPortfolio computes your Sharpe ratio automatically, so you compare your portfolios by their risk-adjusted return and not just by the percentage they earn. That way you know whether the risk you are taking on is worth it.
Frequently asked questions
What does the Sharpe ratio measure?
The return you earn for each unit of risk you take on. It compares what you earn above a risk-free asset with how much your portfolio swings, which is why it is a measure of risk-adjusted return.
How do you calculate the Sharpe ratio?
Subtract the risk-free rate, for example that of a Treasury bill, from the portfolio's return, and divide the result by the portfolio's volatility (its standard deviation).
What is a good Sharpe ratio?
As a rough guide, below 1 is modest, between 1 and 2 is good, and above 2 is excellent. It is most useful for comparing portfolios or funds against each other over the same period, not as an absolute grade.
What does a negative Sharpe ratio mean?
That the portfolio returned less than the risk-free rate over that period: you would have been better off with a risk-free asset. You are not being paid for the risk you take on.
What is the difference between the Sharpe ratio and the Sortino ratio?
The Sharpe ratio uses all of the volatility, so it penalizes rises and falls alike. The Sortino ratio only counts downside volatility, the kind that actually hurts an investor.