
Risk · 2 of 3
Drawdown: how much you were down (and why it matters)
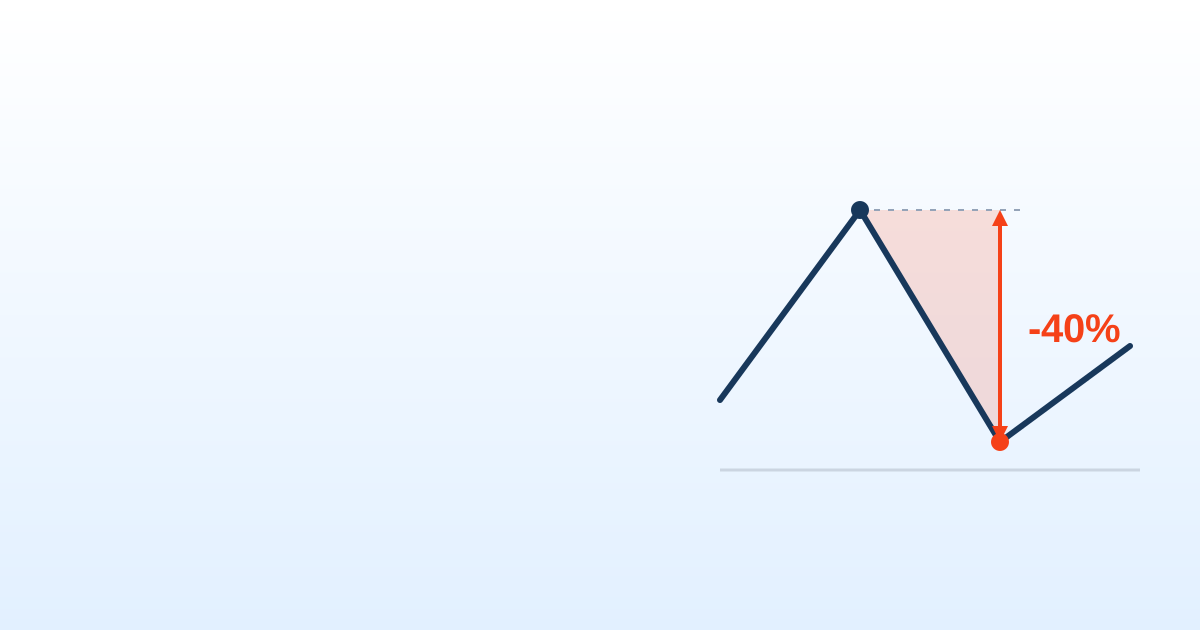
The scariest number in an investment usually is not the return, but how much you were down at some point along the way. That drop from a peak to the low that follows is the drawdown (the maximum fall), and learning to read it tells you what risk you are really taking on.
5 min read
In short
- The drawdown is a portfolio's fall from a peak to the lowest point that follows, as a percentage; the maximum drawdown is the worst of those falls over a period.
- Losses and gains are not symmetric: after a 50% fall you need a 100% rise to get back to where you started.
- The rise needed to recover a fall is fall ÷ (1 − fall): a −20% fall needs +25%, and a −33% fall needs +50%.
- Before investing, look at the historical maximum drawdown and ask yourself whether you could sit through that fall without selling.
What the drawdown is
The drawdown is the drop from a peak to the trough that comes after it: how far your portfolio fell from its best moment before recovering. It is measured as a percentage. The maximum drawdown (or max drawdown) is the worst of all those falls over a period: the deepest hole you had to sit through.
Two portfolios can end the year with the same return and yet have been completely different experiences: one rose in almost a straight line, the other fell 35% along the way. That 35% is the number that truly tests your stomach, because it is the moment when many people panic-sell and turn a temporary loss into a permanent one.
The math of recovery
Here is what almost nobody accounts for: losses and gains are not symmetric. To recover from a fall you need a rise bigger than the fall itself, because you are starting from a smaller base.
If you lose 50%, gaining 50% back is not enough: you need +100% just to get back to where you were. A 20% fall demands a +25% to recover; a 33% fall, a +50%. The deeper the drawdown, the more disproportionate the effort to climb out of the hole.
That is why a big drawdown is not just uncomfortable: it sets you back for years. Avoiding deep falls usually matters more to your final result than nailing the upswings.
How to use it
Check the maximum drawdown before you invest
Before you pick a fund or a strategy, look up its worst historical fall. That is the scenario you will have to sit through without selling if it happens again.
Ask yourself whether you could sleep through that fall
Picture that loss on your real money. If a −40% would make you sell in the middle of the night, that investment does not fit your tolerance, however good its return.
Compare investments by drawdown, not just by return
Between two options with similar performance, the one that falls less is usually the better one: you get to the same place with less fear along the way.
The takeaway
The drawdown measures the pain, not just the result. It is the figure that decides whether you will stay invested long enough for the return to do its job, or sell at the worst possible moment.
MyPortfolio shows you your portfolio's drawdown so you judge the risk, not only the return, and choose investments you can hold on to when the market turns ugly.
Frequently asked questions
What is a drawdown?
It is the fall from a peak to the trough that comes after it: how far a portfolio dropped from its best moment before recovering. It is expressed as a percentage.
What does maximum drawdown mean?
It is the worst peak-to-trough fall over a period, the deepest hole you would have had to sit through. It is the number that tests your risk tolerance.
How do you calculate drawdown?
Divide the value at the lowest point by the previous peak and subtract 1. If the portfolio went from €10,000 to €7,000, the drawdown is 7,000 ÷ 10,000 − 1, or −30%.
How much do you need to gain to recover from a loss?
More than you lost: rise needed = fall ÷ (1 − fall). A −20% fall needs +25%, a −33% fall needs +50% and a −50% fall needs +100%.
What is a good maximum drawdown?
There is no figure that suits everyone: it depends on how far you could watch your money fall without selling. Between two investments with similar returns, the one with the smaller drawdown is usually the better choice.