
Risk · 4 of 4
Your portfolio's quality score: what it measures and how it is calculated
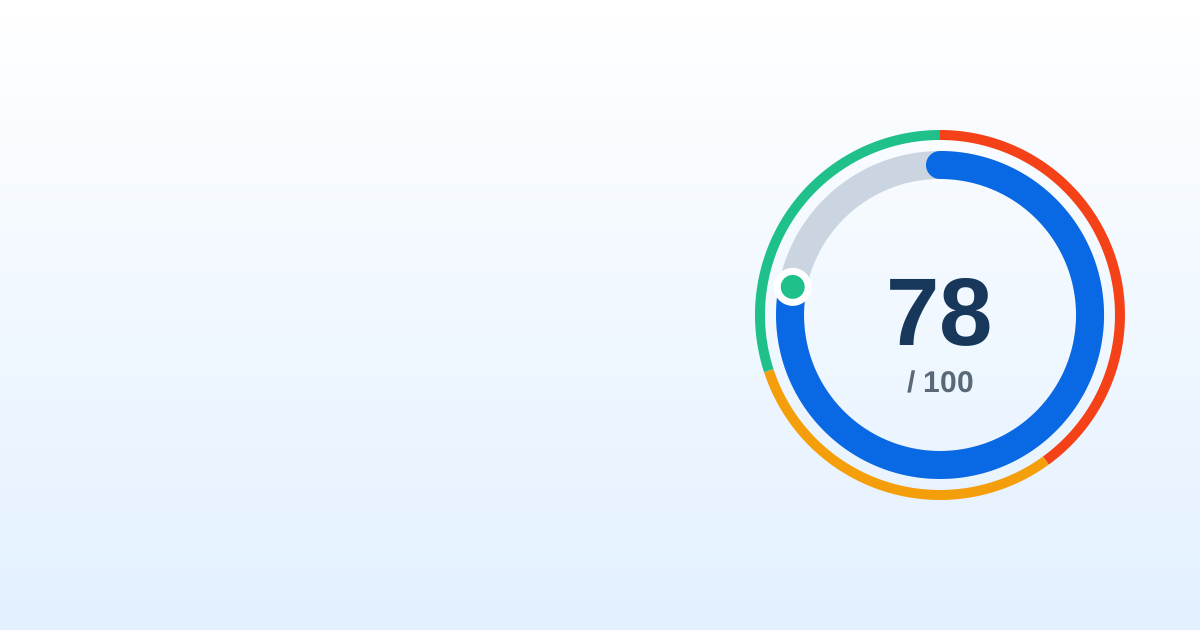
In the header of every portfolio, next to the return, there is a “Quality” score from 0 to 100. It does not tell you how much you have made, but how you made it: whether that return cost you a lot of scares or only a few. Here is exactly what data it uses, how much each part weighs and how to read yours.
8 min read
In short
- The quality score rates from 0 to 100 how a portfolio earned its return: up to 65 points come from the Sortino ratio and up to 35 from the maximum drawdown.
- The Sortino ratio measures what the portfolio earns above 2% a year for each unit of downside risk; the maximum drawdown takes nothing off up to 10% and takes everything off from 50%.
- From 70 to 100 is a high score, from 40 to 69 medium and from 0 to 39 low; a money market fund scores around 50 and the MSCI World around 60 over the last five years.
- Your portfolio's score looks at the last 12 months and, with less than a year of history, it is pulled towards 50.
What the quality score is
The quality score sums up in a number from 0 to 100 how your portfolio has behaved. It does not compete with the return, it completes it: two portfolios that make the same can have done it in very different ways, one with hardly a bump and the other with falls that keep you up at night.
It is built from two ingredients and nothing else. The Sortino ratio weighs 65%: up to 65 points for what you earn in exchange for downside risk. The maximum drawdown weighs 35%: up to 35 points that you lose the deeper your worst slump has been.
The result is read in bands: from 70 to 100 is a high score (green dot), from 40 to 69 medium (amber) and from 0 to 39 low (red).
The Sortino ratio: what you earn for each scare (65 points)
The Sortino ratio is a close relative of the Sharpe ratio: it also divides what you earn by the risk you take. The difference is that it only counts the bad days as risk. Your portfolio rising sharply does not scare you, so it is not penalized.
What you earn is measured above 2% a year, roughly what a euro money market fund pays. If your portfolio does not clear that bar, it has paid you nothing for taking risk. And the bad days are the ones that return less than that.
There is a floor for risk: downside swings are never counted as less than 2% a year. Without it, a portfolio that barely moves would divide by almost zero and get a sky-high score it did not deserve.
The Sortino ratio is turned into points with the table below. If the portfolio earns less than that 2%, the Sortino comes out negative and this block gives fewer than 13 points; with a Sortino of −1 or worse, none.
| Annual Sortino | Points (out of 65) |
|---|---|
| −1 or less | 0 |
| 0 | 13 |
| 1 | 36 |
| 2 | 52 |
| 3 | 62 |
| 4 or more | 65 |
The maximum drawdown: the worst slump (35 points)
The maximum drawdown is how far your portfolio fell from a peak to the lowest point that came after it. It is the moment when it is hardest not to sell.
A fall of up to 10% takes nothing off: it is the normal ups and downs of any portfolio with shares. Beyond that, each point of fall takes points off in a straight line, until a fall of 50% or more wipes out all 35 points.
It is measured on the portfolio's return (TWR), not on its value in euros. That way, taking money out does not count as a fall and putting money in does not hide a real one.
| Maximum drawdown | Points (out of 35) |
|---|---|
| 10% or less | 35 |
| 20% | 26 |
| 30% | 18 |
| 40% | 9 |
| 50% or more | 0 |
Which period your score looks at
The score in your portfolio's header is calculated from each day's return over the last 12 months. It is a snapshot of the last year, not of the portfolio's whole history.
A minimum of movement is needed: if over those 12 months the portfolio's value changed on fewer than 10 days (for example, because it is almost all cash), there is no score.
With less than a year of history, the score is pulled towards 50 in proportion to what is missing to complete a year of trading sessions. With half a year, for example, a portfolio that would score 80 over a full year stays at 65. A few calm weeks do not prove that a portfolio is well managed.
In leagues and tournaments the score uses the same formula, but over the competition's dates and without pulling it towards 50.
How to read your score
Look at the band before the number
From 70 to 100 is high, from 40 to 69 medium and from 0 to 39 low. Between a 62 and a 64 there is no difference that matters; between a 45 and an 80, there is.
Compare it with the references
A money market fund scores around 50 and the MSCI World around 60 over five years that include a bad one. If your portfolio is above that, you have earned your return with fewer scares than the global market.
Open the breakdown to see what drives it
When you hover over or tap the score you see its Sortino and its maximum drawdown. A low Sortino says the risk has paid you little; a big drawdown, that the worst moment was tough.
Do not judge a new portfolio by its score
With less than a year of history the score is still pulled towards 50. Wait until you have a full year before drawing conclusions.
| Reference | Approximate score |
|---|---|
| Euro money market fund | 50 |
| MSCI World, last five years (with 2022) | 60 |
| MSCI World, its best recent year | 90 |
What the score does not tell you
The score looks backwards: it sums up how the portfolio has behaved, not how it will. A calm year can raise it without the portfolio being any less risky than before.
Nor does it measure diversification, fees or whether the portfolio fits your goals. And it does not replace the return: first look at how much you make, then use the score to see at what price you made it.
In MyPortfolio we calculate it automatically for every portfolio, from its daily history, so you can compare not only how much your portfolios make but how they do it.
Frequently asked questions
What data is used to score a portfolio's quality?
Two: the portfolio's Sortino ratio, which provides up to 65 points, and its maximum drawdown, which provides up to 35. Both are calculated from each day's return over the last 12 months.
What is a good quality score?
From 70 to 100 is a high score. As a reference, a euro money market fund scores around 50 and the MSCI World around 60 over the last five years, 2022 included.
Why does my new portfolio have a score close to 50?
Because with less than a year of history the score is pulled towards 50 in proportion to how much is missing. A few calm weeks are not enough to tell whether a portfolio is well managed.
Does the number of positive days count?
No. The score only looks at the Sortino ratio and the maximum drawdown. A portfolio can rise on only a few days and gain a lot on them, or rise a little almost every day and sink on a single one.
Do contributions and withdrawals change the score?
No. It is calculated from the portfolio's return (TWR), which does not move when you put money in or take it out, so a withdrawal does not count as a fall and a contribution does not hide a real fall.